The Perspective Camera - An Interactive Tour

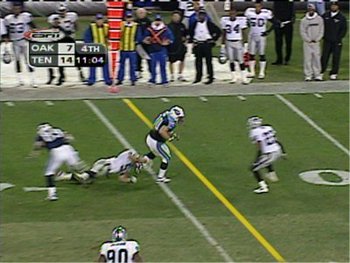
On September 27, 1998 a yellow line appeared across the gridiron during an otherwise ordinary football game between the Cincinnati Bengals and the Baltimore Ravens. It had been added by a computer that analyzed the camera's position and the shape of the ground in real-time in order to overlay thin yellow strip onto the field. The line marked marked the position of the next first-down, but it also marked the beginning of a new era of computer vision in live sports, from computerized pitch analysis in baseball to automatic line-refs in tennis.
In 2006, researchers from Microsoft and the University of Washington automatically constructed a 3D tour of the Trevi Fountain in Rome using only images obtained by searching Flickr for "trevi AND rome."
In 2007, Carnegie Mellon PhD student Johnny Lee hacked a $40 Nintento Wii-mote into an impressive head-tracking virtual reality interface.
In 2010, Microsoft released the Kinect, a consumer stereo camera that rivaled the functionality of competitors sold for ten times its price, which continues to disrupt the worlds of both gaming and computer vision.
What do all of these technologies have in common? They all require a precise understanding of how the pixels in a 2D image relate to the 3D world they represent. In other words, they all hinge on a strong camera model. This is the first in a series of articles that explores one of the most important camera models in computer vision: the pinhole perspective camera. We'll start by deconstructing the perspective camera to show how each of its parts affect the rendering of a 3D scene. Next, we'll describe how to import your calibrated camera into OpenGL to render virtual objects into a real image. Finally, we'll show how to use your perspective camera to implement rendering in a virtual-reality system, complete with stereo rendering and head-tracking.
This series of articles is intended as a supplement to a more rigorous treatment available in several excellent textbooks. I will focus on providing what textbooks generally don't provide: interactive demos, runnable code, and practical advice on implementation. I will assume the reader has a basic understanding of 3D graphics and OpenGL, as well as some background in computer vision. In other words, if you've never heard of homogeneous coordinates or a camera matrix, you might want to start with an introductory book on computer vision. I highly recommend Multiple View Geometry in Computer Vision by Hartley and Zisserman, from which I borrow mathematical notation and conventions (e.g. column vectors, right-handed coordinates, etc.)
Technical Requirements
Equations in these articles are typeset using MathJax, which won't display if you've disabled JavaScript or are using a browser that is woefully out of date (sorry IE 5 users). If everything is working, you should see a matrix below:
3D interactive demos are provided by three.js, which also needs JavaScript and prefers a browser that supports WebGL ( Google Chrome works great, as does the latest version of Firefox). Older browsers will render using canvas, which will run slowly, look ugly, and hurl vicious insults at you. But it should work. If you see two spheres below, you're in business.
Table of Contents
Below is a list of all the articles in this series. New articles will be added to this list as I post them, so you can always return to this page for an up-to-date listing.
- Dissecting the Camera Matrix, Part 1: Intrinsic/Extrinsic Decomposition
- Dissecting the Camera Matrix, Part 2: The Extrinsic Matrix
- Simulating your Calibrated Camera in OpenGL - part 1, part 2
- Dissecting the Camera Matrix, Part 3: The Intrinsic Matrix
- Stereo Rendering using a Calibrated Camera
- Head-tracked Display using a Calibrated Camera
Happy reading!
Posted by Kyle Simek